Powerline Connection Speed Monitoring via `pla-util`
Table of Contents
First off, if you can have a real network cable, use that. As temporary measure I set up a powerline connection between the apartment and basement. Connection speeds vary quite a bit and I wanted to be able to monitor reported network speeds.
ghcr.io/peanball/pla-util.Similar to Wi-Fi, network speeds reported and achieved are quite different. The adapter shows 200-300 MBit/s, while realistically you might end up getting about 50MBit/s. Either way it’s fine for daily work and video conferences – or at least this what the experiment is about.
My Setup #
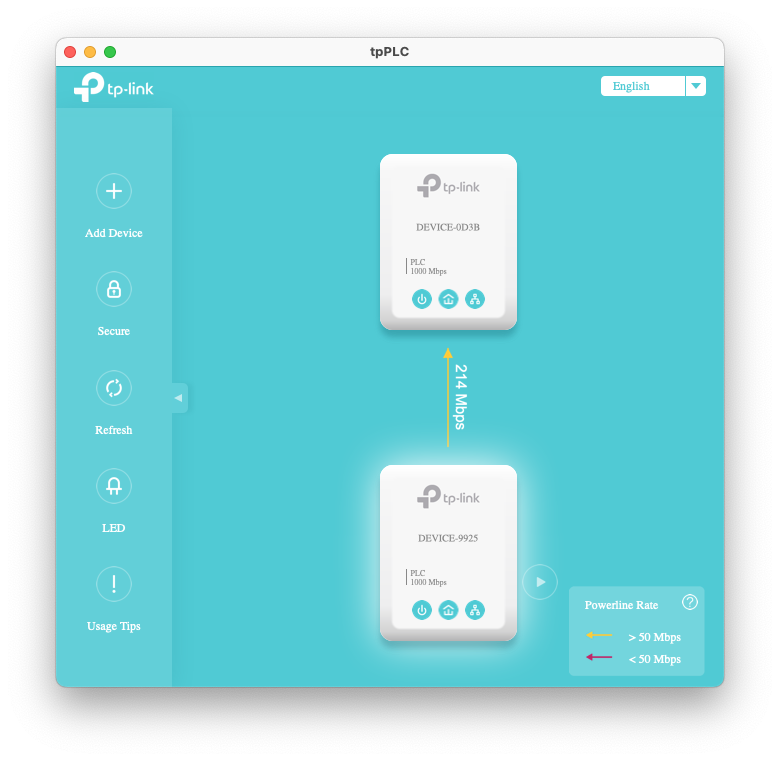
I am using the TP-Link TL-PA7017 for connections.
It is based on the Broadcom BCM60355 chip and does support the HomePlug AV 2.0 standard.
TP-Link offers their tool tpPLC via their support site. It is only available for MacOS and Windows, not Linux.
Linux Based Tools #
My goal was to add continuous metrics into my monitoring setup, so I can see how the data rate develops throughout the day and with different devices switched on or off. I set off to find a command line utility for Linux that gets me this data.
I found the following:
- qca/open-plc-utils - Those tools would be great, but they are for Qualcomm Atheros based chips only. TP-Link does not use those, but it might still be helpful for someone else.
- jbit/powerline - A Rust library for interacting with Qualcomm and Broadcom Powerline chips. Currently, it does not support retrieving the reported network speed.
- serock/pla-util - A tool based on ADA, specifically for Broadcom Powerline chips.
After getting pla-util to compile and run on a Raspberry Pi without any issues, I got the information I want:
pla-util -i eth0.1 get-network-stats:
Number of stations: 1
Station 1:
  Destination Address (DA):  c0:c9:e3:21:0d:3b
  Avg PHY Data Rate to DA:   222 Mbps
  Avg PHY Data Rate from DA: 319 Mbps
Metrics Capturing #
The next step is to get these values continuously. I’m using OpenWRT on my Raspberry Pi 4 Router.
The router has Docker available and currently uses collectd to collect metrics into an InfluxDB / Grafana setup.
The goal is then to run something that can call pla-util automatically. collectd supports the exec plugin that allows to write a script
Docker Image and Container for pla-util #
First off, pla-util needs to run on the target host, which in this case is the Raspberry Pi. I chose to run the tool in Docker because I don’t want to deal with installing the ADA runtime libraries in OpenWRT.
The installation instructions for pla-util are great and get you a running executable on the platforms relevant for me:
- x86_64 (the Mac),
- arm64 (Raspberry Pi 4),
- arm/v7 (newer Raspberry Pi < 4)
The various compilers and libraries needed for it add up to ≈180 MB in the Docker image.
Looking at the libraries that the resulting tool actually needs, you can figure out, which runtime dependencies are needed:
ldd /bin/pla-util:
linux-vdso.so.1 (0x0000007f99ddf000)
libpcap.so.0.8 => /lib/aarch64-linux-gnu/libpcap.so.0.8 (0x0000007f99c20000)
libgnat-12.so => /lib/aarch64-linux-gnu/libgnat-12.so (0x0000007f997e0000)
libgcc_s.so.1 => /lib/aarch64-linux-gnu/libgcc_s.so.1 (0x0000007f997a0000)
libc.so.6 => /lib/aarch64-linux-gnu/libc.so.6 (0x0000007f995f0000)
/lib/ld-linux-aarch64.so.1 (0x0000007f99da2000)
libdbus-1.so.3 => /lib/aarch64-linux-gnu/libdbus-1.so.3 (0x0000007f99570000)
libm.so.6 => /lib/aarch64-linux-gnu/libm.so.6 (0x0000007f994d0000)
libsystemd.so.0 => /lib/aarch64-linux-gnu/libsystemd.so.0 (0x0000007f993e0000)
libcap.so.2 => /lib/aarch64-linux-gnu/libcap.so.2 (0x0000007f993b0000)
libgcrypt.so.20 => /lib/aarch64-linux-gnu/libgcrypt.so.20 (0x0000007f992a0000)
liblzma.so.5 => /lib/aarch64-linux-gnu/liblzma.so.5 (0x0000007f99250000)
libzstd.so.1 => /lib/aarch64-linux-gnu/libzstd.so.1 (0x0000007f99190000)
liblz4.so.1 => /lib/aarch64-linux-gnu/liblz4.so.1 (0x0000007f99140000)
libgpg-error.so.0 => /lib/aarch64-linux-gnu/libgpg-error.so.0 (0x0000007f990f0000)
Dockerfile #
This results in a two-stage Dockerfile, where the builder stage has all the build tools and is ultimately discarded.
The final stage takes the pla-util binary from the builder stage, installs the runtime requirements identified above
and makes a nice slim image with just the libraries you need to run the tool, not to compile it.
FROM debian:12-slim as build

COPY . /pla-util
RUN apt update && \
    apt install -y gprbuild gnat git libpcap-dev && \
    cd pla-util && \
    gprbuild -p -P pla_util.gpr

FROM debian:12-slim

# Install all dependencies for running `pla-util`, and net-tools to have access to `ifconfig`.
RUN apt update && apt install -y \
    libgnat-12 \
    libgpg-error0 \
    liblz4-1 \
    libzstd1 \
    liblzma5 \
    libgcrypt20 \
    libcap2 \
    libsystemd0 \
    libpcap0.8 \
    libdbus-1-3  \
    libgcc-s1 \
    net-tools

COPY --from=build /pla-util/bin/pla-util /bin
collectd metrics scripts for the exec plugin #
Some important notes about collectd exec scripts:
- The script can be a one-off and will be executed at the desired interval. This is great for debugging.
- The script may be a loop and create a series of entries.
collectdwill just stream all the results. If the script exits, it’s restarted again anyway. - Metric names must follow the convention of
hostname/item/metric, wheremetricmay either be a name from thetypes.db, or can encode an alternative type.
The last bit cost me a bit of time. With the metric name router/pla/bytes-rx, you end up with the following data in InfluxDB:
- Metric:
pla_value:Tag Value hostroutertypebytestype_instancerx
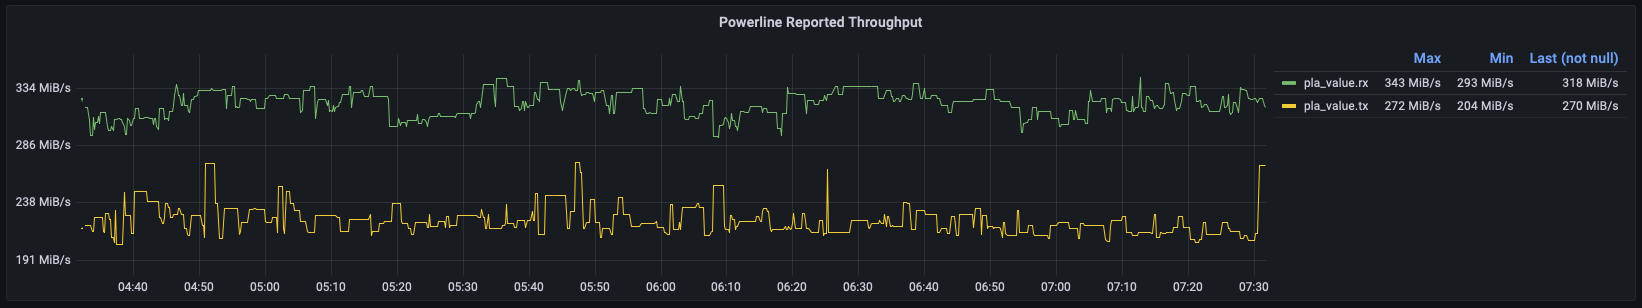
In Grafana you can then set up a query for pla_value and create separate series by type_instance, which leads you to this beautiful graph:
pla-stats script for collectd #
This script assumes a docker-compose setup with a service called pla that has the pla-util container running.
#! /usr/bin/env ash

HOSTNAME="${COLLECTD_HOSTNAME:-localhost}"
INTERVAL="${COLLECTD_INTERVAL:-10}"
INTERFACE=${1:-eth0}

while :; do
    RESULT=$(docker compose -f /root/docker-compose.yml exec pla pla-util -i "$INTERFACE" get-network-stats)
    if [ $? -ne 0 ]; then
       continue
    fi
    TX=$(echo "$RESULT" | sed -n -E 's/.*Avg PHY Data Rate to DA:\s+(\d+) Mbps/\1/p')
    RX=$(echo "$RESULT" | sed -n -E 's/.*Avg PHY Data Rate from DA:\s+(\d+) Mbps/\1/p')

    echo "PUTVAL \"$HOSTNAME/pla/bytes-rx\" interval=$INTERVAL N:$(( RX * 1024 * 1024 ))"
    echo "PUTVAL \"$HOSTNAME/pla/bytes-tx\" interval=$INTERVAL N:$(( TX * 1024 * 1024 ))"

    sleep "$(printf "%.0f" $INTERVAL)"
done
This script is quite limited. It only supports a single result. pla-util happens to default to finding your local network segment’s powerline adapter and query that one.
Powerline Network Analysis with Wireshark #
In case you want to check out the network traffic for Powerline, all control data is exchanged as additional Ethernet protocol.
Wireshark Dissectors:
- serock/mediaxtream-dissector for MediaXtream protocol
- Homeplug AV 2.0, comes bundled with Wireshark.
While trying to find a tool that would help me get the same data as tpPLC, I was very close to writing something myself that would send the few commands and get the network statistics data back. Fortunately I found ready-made tools, because the protocol is quite complex.
Conclusion #
The Powerline setup is temporary until I get a CAT7 cable into the basement.
Accordingly, the monitoring setup is aimed at a single point-to-point Powerline network with one other endpoint. The script shows the concept and can be adapted and extended as needed. Getting additional tags on the data could require a different approach, such as telegraf.
Eventually I plan to migrate all metrics collection from collectd to telegraf anyway. collectd is convenient
as it comes nicely integrated in OpenWRT via luci. It has its limits though, and I am using telegraf on some of the
other machines already.
Telegraf has the same mechanism of capturing data via the exec and execd (for streamed data) plugins.